Custom Report Generation from Dashboards: Tips and Tools
Creating custom reports from dashboards is an essential part of any data-driven business strategy. This process allows organizations to derive insights and communicate findings effectively. Custom reports provide users with the ability to tailor the information presented, ensuring they focus on the most relevant data for their specific needs. Utilizing advanced tools can significantly enhance the process, making it more efficient and user-friendly. Many reporting solutions offer interactive features, allowing users to drill down into metrics for comprehensive understanding. Familiarizing oneself with available functionalities can also aid in maximizing report efficiency. Furthermore, integration with other business analytics tools often leads to extensive custom report capabilities. In addition, ensuring that the dashboard data is consistent and accurate is vital for the credibility of custom reports. Analyzing historical data trends in the dashboard can yield insights that inform future reporting. This article will explore several tips and tools available for generating custom reports efficiently. Remember, effective reporting always hinges on clarity, prompting appropriate actions and decisions based on the data presented.
When discussing tools for creating custom reports, various options stand out that cater to different business needs. Popular tools include Tableau, Power BI, and Google Data Studio. Each tool offers unique features and functionalities, therefore it is essential to select the right one for specific requirements. Tableau, for example, is known for its data visualization capabilities, allowing users to create stunning and interactive dashboards. On the other hand, Power BI is favored for its integration with Microsoft products, making it ideal for businesses embedded within the Microsoft ecosystem. Google Data Studio is an excellent choice for those seeking a free option with decent functionalities. When deciding on a tool, consider factors such as ease of use, customization options, and integration capabilities. Additionally, the tool’s ability to handle large data sets can play a significant role in the decision-making process. Remember to evaluate how well each tool meets reporting goals, user interface preferences, and budgetary constraints to maximize efficient reporting.
Understanding Data Sources
A critical aspect of generating effective custom reports is understanding the data sources that feed into dashboards. Data can come from numerous channels, including databases, spreadsheets, and various applications. It is essential to have a clear comprehension of where the data originates and how it flows into reporting tools. This ensures that custom reports reflect accurate and timely information. Organizations should prioritize data quality and consistency across all input channels. Collaborating with IT departments can provide insights into best practices for data management. Furthermore, utilizing data cleaning techniques can help maintain the integrity of collected data. Often, discrepancies in data can lead to misleading interpretations and poor decision-making. To avoid this, establishing robust data governance frameworks is vital. Regular audits of the data can assist in identifying any potential inaccuracies or inconsistencies. Ensuring that all relevant stakeholders understand these data sources also contributes to transparency and alignment within teams. Ultimately, a well-organized data management strategy lays the foundation for effective custom report generation.
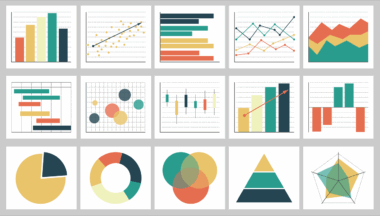
Effective visualization plays an integral role in custom report generation by transforming complex data into digestible insights. Utilizing appropriate charts, graphs, and tables can enhance the readability of reports significantly. Various visualization techniques, such as pie charts for proportion, line graphs for trends over time, and bar charts for comparisons, facilitate a clearer understanding of the data. It is crucial to choose the right visualization instruments that align with the data being represented. Additionally, consider incorporating interactive elements into reports, allowing users to explore data at their convenience. The design of visuals also matters; employing a consistent color palette and clear labeling will prevent confusion. When reports are digestible, users can derive actionable insights quickly and make sound decisions based on the presented data. Incorporating storytelling elements into data visualization enhances engagement and may improve information retention. Ultimately, the aim should be to create compelling reports that attract attention and drive meaningful conversations within the organization regarding data-backed decisions.
Automating Report Generation
Automation of report generation can significantly save time and resources for businesses. Many tools now offer automated reporting features, enabling users to set up reports that refresh regularly with the latest data. This brings increased efficiency and freedom for teams to focus on interpreting results rather than compiling them. Setting parameters for automated reports ensures that relevant stakeholders receive timely information based on their requirements. Users can often customize schedules, identifying how frequently they want reports updated, from daily snapshots to monthly summaries. Moreover, some tools support alert configurations, notifying users of key changes or anomalies in the data. In doing so, businesses enhance their responsiveness and agility, allowing for timely intervention when necessary. It is advisable to test automated reports periodically to ensure accuracy and relevance of the data. Also, stakeholders should remain engaged in the report generation process, providing feedback on content and format. Consistent evaluation of automated reporting practices can lead to continuous improvement in achieving optimal results and maximum utility from the dashboard insights.
Data storytelling serves as a powerful approach when generating custom reports from dashboards. It transcends the mere presentation of data, emphasizing narrative techniques that help contextualize findings. A well-crafted story can engage audiences, making complex data more relatable and easier to understand. By linking the data to real-life scenarios or case studies, businesses can illustrate the relevance of metrics. Structuring reports to follow a narrative format allows users to follow along logically, enhancing comprehension. It is also beneficial to include key insights at the beginning, providing a summary for stakeholders before delving deeper into details. Including visuals alongside anecdotes aids in making the report more appealing. Engaging stakeholders with questions or insights encourages reflection, prompting strategic discussions regarding data interpretations. Additionally, fostering a climate of inquiry invites user participation, thereby enriching the overall reporting process. Reports that incorporate storytelling elements encourage stakeholders to act upon findings and undertake necessary actions driven by data. Ultimately, data storytelling transforms mundane reports into compelling narratives that resonate with the audience.
Conclusion on Custom Reports
In conclusion, generating custom reports from dashboards is a vital process that supports decision-making in today’s data-centric landscape. Understanding tools and methodologies can streamline efforts in this endeavor. Prioritizing effective data management and visualization will enhance report accuracy and integrity. Moreover, harnessing automation simplifies workload while ensuring timely delivery of insights. The engagement of stakeholders through storytelling promotes a deeper understanding of the reports generated. As organizations strive to utilize business analytics successfully, continually revisiting reporting processes is essential. This not only maintains relevance but also optimizes usability for stakeholders across the enterprise. Improvements based on feedback can lead to greater satisfaction and, ultimately, better decision-making. Emphasizing a culture that values data-driven practices will enable companies to adapt and thrive amidst constant changes. By following the tips and leveraging the tools discussed, you can significantly impact your custom report generation process. The journey towards data excellence requires ongoing commitment and adaptation, yet it is essential for enduring success in any business endeavor. Embrace the power of custom reports, as they can empower organizations to realize their full potential through informed decisions.