Creating Real-Time Data Visualizations for Financial Dashboards
Creating dynamic financial dashboards helps businesses visualize their data effectively. These dashboards offer quick insights into key performance indicators, enabling decision-makers to act swiftly. Real-time data visualizations are essential in today’s fast-paced financial landscape. They allow users to monitor financial performance on an ongoing basis, ensuring that they have the most accurate information available. By integrating various data sources, dashboards simplify complex data into understandable visuals. Techniques such as charts, graphs, and gauges make information accessible at a glance. This type of system improves overall productivity by allowing users to focus on the most important metrics. Establishing a coherent data strategy is crucial for maximizing the potential of financial dashboards. Users should prioritize the specific metrics that align with their financial goals. Additionally, customizing dashboards ensures that each user receiving relevant information can make informed decisions based on real insights. Therefore, investing time and resources into developing these interfaces is vital for enhancing business intelligence. Ultimately, well-designed dashboards contribute to better financial performance and a greater competitive edge in today’s market. Understanding the basics of dashboard construction will further support effective financial decision-making.
A key factor in building effective financial dashboards is ensuring data accuracy. High-quality data leads to reliable visualizations, essential for strategic financial planning. Implementing a robust data validation process minimizes errors and enhances trust in these crucial tools. Organizations must also maintain data governance protocols to control data access and integrity. Using real-time data feeds can significantly enhance a dashboard’s effectiveness. This strategy allows immediate updates based on current financial actions or changes. As a result, users can react promptly to evolving market conditions. Furthermore, organizations should assess their technological infrastructure to support the necessary analytics and reporting capabilities. Choosing the right software for dashboard creation is fundamental for success. There are numerous tools, such as Tableau, Power BI, and Google Data Studio, each with unique strengths. Evaluating these options against organizational needs is essential when implementing dashboards. Another aspect involves training users to make the best use of the provided visuals. A well-informed team is better positioned to extract insights and drive financial strategies. Supporting employees with ongoing education on these tools fosters a data-driven culture that emphasizes continuous improvement.
Utilizing Charts and Graphs in Financial Dashboards
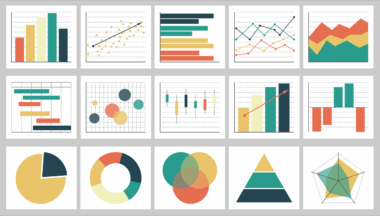
Charts and graphs play a pivotal role in developing visual components for financial dashboards. They translate complex datasets into visual formats that enhance understanding and foster engagement. For instance, bar charts can display revenue changes over time, allowing users to identify trends at a glance. Line graphs are effective for illustrating stock price movements, helping investors visualize market fluctuations. Similarly, pie charts can be used to represent budget allocations, illustrating how resources are distributed across various departments. Selecting the right type of graph is crucial to convey the intended message poorly designed visuals can lead to confusion. Customization options further improve the user experience, enabling the application of branding elements that reflect the organization’s identity. Using color schemes consistently enhances readability and aids in distinguishing between key metrics. Furthermore, interactivity can elevate user engagement significantly, as users appreciate being able to drill down into specific details. This function allows deeper insights rather than simply viewing static information. By combining effective visuals with interactivity, financial dashboards become powerful tools that drive informed decision-making. Continuous updates to visual elements ensure data remains relevant and actionable for users.
Interactive features in financial dashboards can transform how companies analyze and utilize their data. Adding filters, drill-down options, or dynamic visuals empowers users to explore information more meaningfully. By allowing customization of displayed data, users can focus on metrics that are most pertinent to their roles. For instance, a project manager might focus on operational costs while the finance director might monitor overall revenue. This tailored approach improves engagement and enhances the user experience significantly. Users are more likely to interact with tools they find relevant, leading to better utilization of resources. Additionally, the incorporation of predictive analytics can give users insights into future trends based on existing data. Advanced techniques, such as machine learning algorithms, can estimate upcoming financial performance, guiding strategic planning. Combining historical data with real-time information through these methods has incredible potential for business forecasting. Successful dashboard implementations utilize a mix of historical context and forward-looking insights, optimizing long-term financial planning. Furthermore, ensuring visuals adapt smoothly to various devices enhances accessibility, allowing users to engage anytime, anywhere. Thus, responsiveness and interactivity are critical characteristics of successful financial dashboards.
Importance of User Experience in Dashboard Design
A compelling user experience is vital for the success of financial dashboards. Users must find these tools intuitive and easy to navigate. An overly complicated design can lead to frustration, decreasing the likelihood that they will use the dashboard effectively. Therefore, adhering to best practices in user interface design is essential for achieving usability. This includes minimizing the number of clicks required to access essential data while ensuring a logical flow. Moreover, providing clear instructions or tooltips can guide users unfamiliar with the dashboard’s features. Feedback mechanisms, such as surveys, help identify areas for improvement over time. Frequent user testing ensures that the dashboard evolves according to changing requirements. Furthermore, ensuring that the layout is visually appealing can enhance user engagement significantly, since aesthetics play a significant role in user satisfaction. Consistent branding reinforces familiarity and can significantly impact the perceived professionalism of the tool. Finally, analyzing user behavior through analytics can reveal valuable insights, helping organizations make informed decisions regarding necessary changes. Emphasizing user experience in dashboard design fosters better engagement, higher adoption rates, and ultimately contributes to achieving financial goals.
Security protocols are non-negotiable when developing financial dashboards, particularly with sensitive information involved. Protecting data from unauthorized access or breaches is paramount for any organization. Implementing strong authentication measures ensures only authorized users can view and manipulate financial information. Additionally, using encryption methods when transmitting data between systems adds an extra layer of security. Organizations must regularly assess their security measures to adapt to evolving threats, ensuring that their financial dashboards remain protected. Compliance with relevant regulations, such as GDPR, is essential to avoid legal repercussions. Regular audits and assessment of security policies should also be a fundamental practice. Training employees on best practices for data security minimizes risks stemming from human error. Financial dashboards can integrate alerts to notify users of suspicious activity, further safeguarding sensitive information. Engaging with cybersecurity experts can provide invaluable assistance in establishing effective security frameworks tailored for dashboards. Users must be aware of their role in maintaining security, understanding that proactive approaches often prevent breaches. In conclusion, securing financial dashboards is a multi-faceted process that demands ongoing attention and commitment from all stakeholders.
Conclusion: Future of Financial Dashboards
The future of financial dashboards lies in innovation and adaptability. As technological advancements continue to arise, there is a potential for emerging trends to elevate dashboards’ functionality. Integrating advanced technologies like artificial intelligence (AI) and augmented reality (AR) can profoundly enhance user experiences and analytic capabilities. These technologies can provide deeper insights and real-time recommendations that improve financial forecasting. Furthermore, incorporating advanced data visualization techniques will ensure that dashboards remain relevant as user needs evolve. Organizations must be agile and responsive to changing market dynamics, consistently seeking out opportunities for enhancement. The increasing demand for personalized experiences suggests that further customization options will become paramount in dashboard development. Another trend gaining traction is the shift towards cloud-based solutions, offering scalability and accessibility. Companies must adopt systems that facilitate real-time collaboration across global team members regardless of their location. Staying ahead of these trends entrusts organizations with quality decision-making tools that will positively impact their financial futures. Emphasizing a strategic approach to dashboard development will result in significant improvements in performance and insights, align with overall business objectives, and drive long-term success.
As financial dashboards continue to evolve with emerging technologies, ongoing education and training remain crucial for stakeholders. Ensuring that team members are skilled in utilizing these modern tools effectively can lead to significant improvements in their performance and insights. Tailored training programs reflecting the specific tools and features used within the organization can maximize user proficiency. Encouraging collaboration amongst teams will also facilitate a knowledge-sharing environment, ensuring best practices are adopted universally. Adapting to changes quickly ensures organizations are well-equipped to capitalize on technological advancements. Monitoring industry trends and attending relevant workshops help teams stay ahead of competitors. Networking with peers and experts in the field fosters continuous learning and adaptation to market shifts. Continuous investment in technology and training not only improves operational efficiency but also enhances overall organizational agility. This commitment to education also illustrates a dedicated effort to creating data-driven cultures among organizations. As dashboards become increasingly integrated into daily financial operations, their role expands beyond simple reporting. By embracing innovation throughout the organization, the future of financial dashboards promises even greater insights and efficacy, paving the way for enhanced business strategies.