Understanding the Basics of Business Analytics Dashboards
Business analytics dashboards are vital tools designed to help organizations visualize data insights effectively. They integrate information from various sources, transforming complex data sets into accessible graphics. These dashboards enable businesses to monitor key performance indicators (KPIs) in real-time, thereby allowing teams to make informed decisions swiftly. A well-structured dashboard typically consists of various elements such as charts, graphs, and tables that showcase metrics relevant to specific objectives. Furthermore, users can customize dashboards to suit their analytical needs, which increases efficiency. As a result, stakeholders can track progress towards goals seamlessly, enabling organizations to pivot strategies when necessary. Understanding what elements to include is essential for creating effective dashboards. Consistent color schemes, readable fonts, and logical layouts are crucial for enhancing user experience and comprehensibility. Moreover, incorporating filtering options allows users to interact more dynamically with the data, leading to greater insights. In this digital age, the ability to derive actionable intelligence from the mountains of data available is imperative for success. Hence, mastering dashboards is a strategic asset for businesses aiming for operational excellence and sustained growth.
Key Components of Effective Dashboards
Effective dashboards comprise several essential components that enhance their utility and efficiency in business analytics. Firstly, the visualization aspect is critical; utilizing the right types of charts and graphics can significantly impact data interpretation. For instance, line graphs may represent trends over time, while pie charts illustrate proportions. Secondly, intuitive navigation plays a vital role, as users should easily find the information they require without extensive training. Including a dashboard legend is helpful for interpreting complex visuals. Thirdly, personalized scorecards allow users to monitor specific metrics relevant to their roles. This individualization fosters accountability and encourages teams to track their performance realistically. Moreover, data integration remains a central component, with dashboard systems often pulling data from multiple sources such as databases, APIs, and spreadsheets. An automated update function is also beneficial, ensuring that users have the most current data at their disposal. Finally, the mobile compatibility of dashboards cannot be overlooked; business professionals require access to analytics on-the-go. Setting up alerts for critical KPIs ensures users are immediately informed of any changes, thus enhancing responsiveness. Together, these components create a comprehensive analytics landscape.
The significance of user experience (UX) in dashboard design cannot be overstated. A positive UX ensures that users can quickly access and comprehend necessary information without confusion. A cluttered dashboard can overwhelm users, detracting from the primary objective of monitoring key metrics efficiently. Therefore, utilizing whitespace effectively helps in achieving a visually appealing layout. Clarity in data presentation is paramount; each element should have a clear purpose to avoid misinterpretation. Additionally, collaborating with end-users during the design process ensures that dashboards align with their specific needs and expectations. Soliciting feedback is vital in refining and improving the design, ensuring usability is prioritized. Implementing interactive features, such as drill-down options, enhances engagement by allowing users to explore data at different levels. Furthermore, consistent updates through periodic reviews help maintain the relevance of the dashboard. Regular assessments ensure that the metrics displayed continue to serve the evolving objectives of the organization. The overall goal of an effective dashboard is to facilitate swift decision-making by providing insight into performance and trends while minimizing the cognitive load on users. Therefore, focusing on user-centered design principles is essential for successful business analytics dashboards.
The Role of Data Visualization
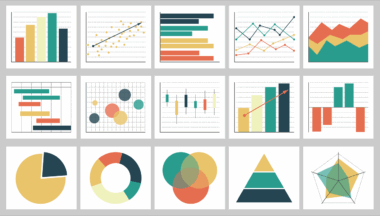
Data visualization serves as the bridge between complex analytics and ease of understanding in business dashboards. Visualization techniques transform numerical data into visual formats, enhancing comprehension and engagement. Well-designed visuals can instantly reveal patterns, trends, and anomalies that might be hidden in raw data. For instance, leveraging bar charts can highlight year-over-year growth effectively, while scatter plots can illustrate correlations. The use of color gradients improves visibility and can draw immediate attention to critical areas needing focus. When designing visuals, it’s important to choose appropriate color schemes and types that align with the insights intended to be conveyed. Additionally, interactive visualizations, such as hover-over tooltips or clickable charts, allow users to access detailed data seamlessly. This interaction enhances the user experience and engagement with the data presented. Furthermore, storytelling through data visualization encourages users to relate emotionally to the metrics, fostering a deeper understanding of their implications. Ultimately, the goal of incorporating effective data visualization in business analytics dashboards is to make insights not only accessible but also actionable. Thus, investing in quality visualization design is crucial for maximizing the dashboard’s utility and effectiveness in decision-making processes.
The importance of maintaining accuracy and timeliness of data in business analytics dashboards must be highlighted. Accurate data forms the foundation upon which strategic decisions are made, and any discrepancies can lead to misguided strategies and poor outcomes. Regular audits of data sources should be conducted to ensure that the information fed into dashboards is reliable. Additionally, utilizing automated systems to pull data reduces the chances of human error. Each data point displayed on the dashboard must be verified to maintain integrity and trust. Moreover, timeliness is as crucial as accuracy; stale data can render insights obsolete and potentially harmful for decision-making. To address this, organizations must establish a consistent update schedule, specifying how often data should refresh and in what manner. Dashboards should present a clear timestamp indicating the last data update to inform users effectively. This transparency enhances confidence in the data presented and encourages users to rely on the insights provided. Finally, incorporating feedback loops to gather input from users helps continuously refine data quality and accuracy. Therefore, prioritizing data integrity ensures that business analytics dashboards serve their intended purpose of driving informed decisions and spearheading organizational growth.
Best Practices for Dashboard Implementation
Implementing business analytics dashboards involves several best practices that can enhance effectiveness and user adoption. Initially, it’s imperative to define the goals of the dashboard clearly; understand what insights users need and the specific business questions to address. This clarity will guide the selection of metrics and visualizations employed. Furthermore, involving users in the development process is crucial; their input will ensure the dashboard meets practical needs and encourages buy-in. Conducting training sessions on how to navigate the dashboard effectively will also empower users to utilize it fully. Another best practice is to maintain a focus on clarity and simplicity; dashboards should only display relevant information, avoiding the temptation of incorporating extraneous data. This helps streamline users’ attention toward the most critical metrics. Additionally, selecting a flexible platform that allows easy modification ensures the dashboard remains adaptable to changing business needs. Establishing routines for regular updates and maintenance further supports the dashboard’s relevance and functionality. Lastly, promoting an analytical mindset within the organization encourages teams to rely on dashboards for data-driven decision-making. Together, these best practices facilitate a successful dashboard implementation process.
In conclusion, mastering the intricacies of business analytics dashboards greatly enhances an organization’s ability to leverage data for strategic advantage. Dashboards function as accessible tools to visualize and interpret complex data sets, ultimately driving informed decision-making processes. The key components of successful dashboards, including user experience, effective data visualization, accuracy, and timely data, must be prioritized throughout their design and implementation. Furthermore, adhering to best practices not only ensures user adoption but also cultivates a data-centric culture within the organization. Engaging users during the design phase, continuously updating the dashboard, and focusing on clarity and relevance will facilitate a successful analytical journey. Effective dashboards enable businesses to not only monitor performance but also to identify growth opportunities, optimize operations, and pivot strategies as required. Thus, in a continuously changing business environment, investing in quality dashboards should be regarded as a strategic priority. As organizations strive for operational excellence and a competitive edge, understanding how to harness the power of business analytics becomes paramount. By following these principles, businesses can empower their teams with actionable insights that pave the way for future successes.
Future Trends in Business Dashboards
Looking ahead, several future trends could reshape the landscape of business analytics dashboards. The integration of artificial intelligence (AI) and machine learning could automate data analysis, providing predictive insights and eliminating manual data processing. This shift would ensure that users receive timely and relevant data, prompting proactive decision-making rather than reactive measures. Another trend is the rise of self-service analytics, empowering users at all levels to explore data independently without relying on IT. This democratization of data would encourage a culture of exploration and innovation within organizations. Additionally, responsive and adaptive dashboards that adjust based on user behavior are likely to become prevalent. Such adaptability ensures that critical information surfaces as needed, enhancing the overall user experience. Moreover, mobile-first designs will gain prominence as more professionals seek access to analytics on their smartphones and tablets while on the go. Finally, the incorporation of augmented reality (AR) and virtual reality (VR) technologies could present data in immersive environments, facilitating enhanced comprehension. By embracing these emerging trends, organizations can continue to evolve their dashboard strategies to stay competitive and responsive in an ever-changing business landscape.