Using Dashboards to Monitor Sales and Revenue Metrics
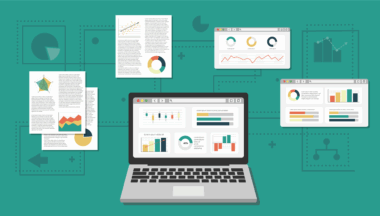
In today’s fast-paced business environment, dashboards serve as an essential tool for companies aiming to optimize their sales and revenue tracking. A well-structured dashboard provides instant insight into key performance indicators (KPIs), enabling stakeholders to make informed decisions rapidly. The primary components typically displayed on sales dashboards include total sales, revenue growth percentage, and sales forecasts. By combining data from various sources, businesses can visualize trends and performance over time. Dashboards facilitate real-time data analysis, which is crucial for staying competitive. When creating a dashboard, businesses must ensure their metrics are relevant and aligned with organizational goals. An effective dashboard can highlight areas needing immediate attention or improvement, guiding teams on their priorities. Furthermore, integrating predictive analytics within dashboards can yield significant insights, helping businesses anticipate future sales patterns. Utilizing dashboards can transform raw data into actionable metrics, ultimately influencing strategic planning and execution. This not only enhances accountability but also empowers teams to optimize their efforts and align with the company’s broader objectives, ensuring sustained growth and success.
The layout and design of your dashboard significantly impact how easily users can interpret data. A clean and intuitive interface is vital for user engagement and comprehension. Utilize colors wisely; use contrasting hues for highlighting important figures while ensuring readability. Infographics and visual representations can aid in conveying complex data effectively. Charts, histograms, and line graphs are common tools for visualizing trends. Users often appreciate drill-down capabilities, allowing them to delve deeper into specific areas without overwhelming datasets. Implementing filters within dashboards can cater to various user preferences, enabling customized views. The accessibility of statistics across teams promotes a collaborative environment, fostering informed discussions. Additionally, regular updates on dashboard content keep all stakeholders informed about significant developments. Real-time features enable immediate reactions to changing trends or issues. Effective communication of sales and revenue metrics can lead to proactive strategies. Linking individual and team performance directly to revenue metrics helps in motivating staff. Moreover, the ability to perform benchmarking against industry standards can provide a clearer perspective on market positioning. Ultimately, well-designed dashboards not only track metrics but also drive performance improvements and strategic focus.
Key Metrics to Include in Sales Dashboards
To create an impactful sales dashboard, selecting the right metrics is paramount. Key metrics often included are total sales revenue, number of transactions, and average deal size. Sales growth over specific periods provides insight into overall business trends. Monitoring sales by specific regions helps in identifying lucrative markets or areas needing focus. Furthermore, analyzing customer acquisition cost and customer lifetime value can reveal the effectiveness of sales strategies. Incorporating conversion rates throughout different stages of the sales funnel allows for assessing the efficiency of the sales process. Additionally, tracking lead sources where conversions happen can fine-tune marketing efforts, diverting resources wisely. Considering sales forecast accuracy enables teams to prepare proactively for future business cycles. Another vital metric is sales member performance; individual contributions can be easily measured and compared. Performance dashboards highlighting team achievements and areas of improvement can foster competition and innovation. By regularly reviewing these metrics, organizations can keep sales strategies aligned with market demands and internal capabilities while continuously driving towards enhanced performance and efficiency.
The integration of advanced analytics into dashboards can heighten their effectiveness exponentially. Predictive analytics allows businesses to foresee potential challenges and opportunities, turning static data into dynamic insights. Leveraging machine learning algorithms can identify patterns in sales data that might not be immediately visible. This predictive power can lead to proactive decision-making rather than reactive measures, which often fall short. Moreover, integrating customer relationship management (CRM) systems with sales dashboards provides a richer data context. The historical data provided by CRM systems can indicate customer behavior trends, helping sales teams tailor their approaches. These integrations also facilitate a seamless flow of information across different departments, breaking down silos that often hinder performance. Establishing a culture where data-driven insights are utilized regularly ensures that all team members understand their roles in achieving business objectives. Additionally, automated alerts and notifications for significant changes in metrics create a more responsive environment. With the right setup, dashboards can effectively guide sales tactics and strategies. Consequently, organizations that embrace advanced analytics within their dashboards are better positioned to adapt, innovate, and excel in today’s competitive business landscape.
The Role of Visualization Techniques
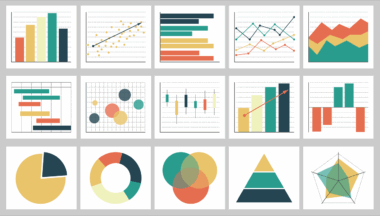
Effective visualization techniques are critical in transforming complex data sets into understandable formats. By using various chart types strategically, it becomes easier to highlight trends and changes in data patterns. Bar charts are excellent for comparing values across different categories, while line graphs are particularly useful for showcasing changes over time. Pie charts can simplify understanding proportions within a whole, though they should be used judiciously for clarity. Moreover, utilizing heat maps can efficiently display intensity in data, where colors reflect performance levels vividly. Infographics combine text and visuals for storytelling, making data more engaging and relatable to users. Additionally, the use of icons and simplified symbols can further enhance dashboard user experience, creating a more approachable atmosphere for examining vital information. When choosing visualization techniques, always consider your audience’s needs and preferences. Consistent, clear labeling, and units of measure help avoid confusion. In tandem with interactive components, like hover-over details, the clarity helps decision-makers act swiftly on important insights. By emphasizing effective visualizations, organizations can ensure their dashboards become valuable tools for analysis and strategy formulation.
Keeping dashboards user-friendly and responsive across devices is crucial in today’s mobile-centric society. Implementing mobile-friendly design means that team members can access critical performance metrics anytime and anywhere. Responsiveness ensures that all users can interact with dashboards seamlessly, regardless of the screen size they are using. Engaging with features like swipe navigation and touch capabilities can significantly enhance usability. Regular feedback from users can direct design improvements and identify any functionality questions. Additionally, training sessions focused on proactive usage can enhance user confidence and optimization of dashboard functionalities. Keeping documentation handy for reference ensures users can troubleshoot independently as needed. Furthermore, automating data updates saves time and ensures that decision-makers are always working with the latest figures. It fosters a culture of continuous improvement and responsiveness to market changes. Enhanced dashboard accessibility leads to wider adoption among stakeholders, resulting in a more data-driven organizational culture. By focusing on user experience, organizations transform complex sales and revenue metrics into tools that energize decision-making, creating an empowered workforce that thrives on data.
Conclusion: The Future of Sales Dashboards
As technology continues to evolve, the future of sales dashboards is geared towards becoming even more intelligent and user-friendly. Innovations in artificial intelligence and machine learning will bring predictive capabilities that enhance decision-making. Dashboards will become more interactive, allowing users to visualize scenarios based on potential changes in data. For example, users may explore ‘what-if’ analyses that can guide strategy formulations effectively. Integration with emerging technologies, such as augmented reality or virtual reality, may also emerge, providing immersive data interaction experiences. These advancements will further encourage data literacy across organizations, ensuring that all members can leverage insights for strategic advantages. Overall, the ongoing optimization of dashboards will empower companies to harness the full potential of their sales and revenue data effectively. Embracing the latest technologies and methodologies will ensure that dashboards remain relevant and invaluable in navigating complex market scenarios. Ultimately, organizations that actively pursue advancements will significantly enhance their operational efficiency, leading to greater financial success. This forward-thinking approach positions companies to adapt swiftly to market changes, ensuring sustainable growth well into the future.
In conclusion, by strategically utilizing dashboards to track sales and revenue metrics, businesses can gain invaluable insight. The right design, integration of analytics, and focus on user experience will amplify the utility of dashboards. They can lead to enhanced accountability, better decision-making, and ultimately, improved performance. Implementing the discussed best practices can pave the way for creating dashboards that not only inform but also inspire action. Companies that commit to refining these tools can harness data’s true potential, driving growth and innovation.