The Role of Visualization in Financial Analytics
Financial data visualization plays a crucial role in today’s financial analytics landscape. With the increasing volume of data, businesses need efficient ways to interpret quantitative information. Data visualization transforms complex financial datasets into intuitive graphic formats, such as graphs and charts. By employing tools that create visual representations, financial analysts can detect trends and outliers. This enhances their decision-making processes significantly. Upper management benefits from visual summaries, allowing them to grasp key financial insights quickly. Moreover, advanced tools for visualization can even provide predictive analytics based on historical data. Engaging visual content helps in storytelling, making it easier to communicate outcomes and recommendations effectively. It not only aids in internal understanding but also facilitates discussions with stakeholders. Visual narratives can bridge the gap between complex data findings and actionable business strategies. Furthermore, tools like Tableau and Power BI empower professionals to create impactful reports. Ultimately, finance professionals who embrace data visualization are better positioned to drive growth and ensure understanding of financial health across their organizations. Analytics without visualization can often lead to misinterpretations, affecting budgeting and forecasting accuracy.
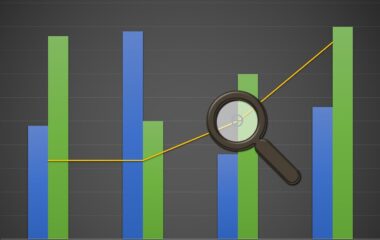
A key benefit of financial data visualization lies in its ability to simplify intricate information. Traditional spreadsheets filled with numbers can be overwhelming and, at times, misleading. By utilizing visuals, stakeholders can more effectively track financial performance indicators. It allows for quick identification of deviations from expected results, thus enabling prompt corrections. Various types of charts serve distinct purposes. For example, line charts are effective for showing trends, while pie charts can depict parts of a whole. Furthermore, scatter plots help visualize correlations between variables, offering deep analytical insights. Integrating interactive dashboards enhances user engagement, allowing viewers to explore data deeper. This capability to interact encourages a more proactive approach to financial monitoring. Another pivotal aspect is the facilitation of predictive modeling. Analysts can use historical data visualizations to forecast future performance, providing strategic foresight. Thus, visual tools not only reveal past performance but also guide future decision-making. Organizations employing sophisticated visual analytics may experience reduced risks overall. Moreover, clearer visual communication also fosters better collaboration among team members, driving cohesive efforts towards common financial goals.
Impact of Visualization on Decision-Making
Effective financial decision-making requires a thorough understanding of available datasets. Visualization inherently enhances comprehension, making it easier for team members from various departments to grasp financial concepts. Substantial amounts of information may contain critical insights, which can be easily overlooked. By translating figures into graphical formats, visual analytics reveal underlying patterns that influence strategic decisions. Financial professionals can quickly assess a company’s operational efficiency, liquidity position, and profitability through clear graphics. Moreover, visuals can encapsulate the results of deep analysis into understandable formats tailored for the audience’s level of expertise. This democratization of financial data equates to greater transparency and inclusivity in discussions. It empowers employees at all levels to contribute to meaningful financial conversations. Consequently, involved departments feel more valued, fostering a culture of collaboration and innovation. Additionally, rapid decision-making is essential in the fast-paced business environment. Visualization accelerates this process by allowing users to process data more swiftly and efficiently. Understandably, organizations adopting strong visual analytics capabilities tend to achieve better results than their counterparts, paving the way for continuous growth in an increasingly competitive market.
Utilizing data visualization can also bring significant enhancements in compliance and risk management within organizations. With visual tools, identifying potential compliance issues becomes less daunting, as it provides a clear picture of financial standings. Visuals can be employed to establish benchmarks crucial for regulatory requirements. Furthermore, deploying real-time dashboards helps monitor ongoing financial risks dynamically. Organizations can readily visualize any discrepancies or financial red flags, ensuring immediate action when required. Such proactive measures not only foster adherence to compliance but also cultivate an informed company culture. Staff members equipped with visual insights are likely to feel more confident navigating regulatory landscapes. Moreover, visualizations can highlight areas needing further investigation, thus prompting timely audits or financial reviews. Incorporating visuals into risk management strategies ultimately leads to heightened awareness and preparedness. Additionally, organizations successfully mitigating financial risks experience improved stakeholder confidence. Regularly reporting risk assessments through visuals articulately assures stakeholders of the company’s commitment to stability. This is increasingly necessary in today’s business climate, where reputation and trust are essential for sustained success. Over time, efficient risk management through visualization builds stronger organizational resilience.
Future Trends in Financial Visualization
The future of financial data visualization appears promising, driven by technological advancements and evolving business needs. Emerging technologies, such as artificial intelligence (AI) and machine learning (ML), are set to revolutionize how organizations process and visualize data. These technologies enable automatic data analysis, providing predictive insights through dynamic visualizations. In turn, this will enhance strategic planning and operational efficiency. Furthermore, the integration of natural language processing within visualization tools is expected to simplify interaction with financial datasets. Users can ask straightforward questions and receive visual answers, democratizing access to data analytics. Additionally, the rise of cloud computing facilitates smoother collaboration and sharing of visualization tools across teams and departments. Such improvements will empower organizations to respond more quickly to financial changes and stakeholder demands. Furthermore, mobile accessibility for data visualization platforms will allow financial professionals to analyze relevant metrics on the go. This heightened accessibility ensures that timely decisions are made, which is indispensable in our fast-paced environment. Ultimately, the convergence of these innovative technologies will lead to more sophisticated, user-friendly financial visualizations. The financial landscape will continue to adapt to these shifts, paving the way for sustainable growth.
In conclusion, the role of visualization in financial analytics cannot be overstated. A well-implemented visualization strategy significantly enhances comprehension and decision-making processes. Finance professionals need to communicate trends and findings efficiently and effectively. With the vast amounts of data generated, visual representation helps distill core insights that drive strategic initiatives. This proactive approach to using visuals can also lead to improved team dynamics, with enhanced collaboration among stakeholders. Furthermore, embracing visual analytics positions organizations favorably for managing risks and adhering to compliance standards. Organizations that fail to adopt these advancements may find themselves lagging behind competitors. Financial visualization is not merely a trend but an essential component of modern financial practice. The ongoing evolution of tools and technologies will further enhance the capabilities of financial visualizations. This will ultimately secure profitability and growth in an increasingly complex environment. As businesses look to the future, staying ahead of trends and continuously optimizing visual tools will be paramount. Increased profitability, better stakeholder communication, and enhanced compliance are inevitable results. In this lens, visualization embodies the bridge between data and actionable financial strategies.
Organizations looking to implement financial data visualization should consider specific strategies for success. It begins with selecting the appropriate tools and software that align with business needs. Many options offer varying features and complexities, catering to different levels of expertise among users. Choosing user-friendly platforms ensures effective training and adoption among team members. Establishing clear guidelines on how data visualization should be leveraged is also fundamental. Creating a consistent approach helps maintain clarity during meetings and presentations. Furthermore, investing in professional development encourages employees to master these visualization tools, improving the overall quality of financial reporting. It is essential to promote a culture that values data-driven decisions, reinforcing the importance of visualization in analytics. Regularly sharing success stories related to effective financial visualization can motivate more teams to embrace these practices. By prioritizing best practices, organizations will unlock the full potential of financial data visualization for sustainable growth and success. Understanding user requirements and continuously refining visualization practices will ultimately lead to notable performance improvements. By making visualization an integral part of financial strategy, businesses position themselves effectively for future challenges and opportunities.