Dashboard Metrics for Investment Portfolio Monitoring
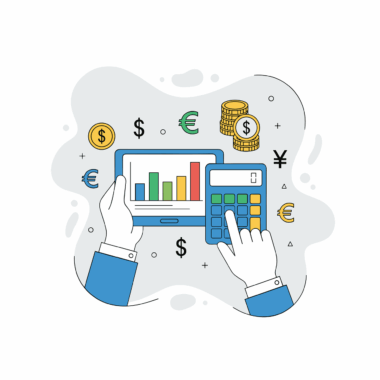
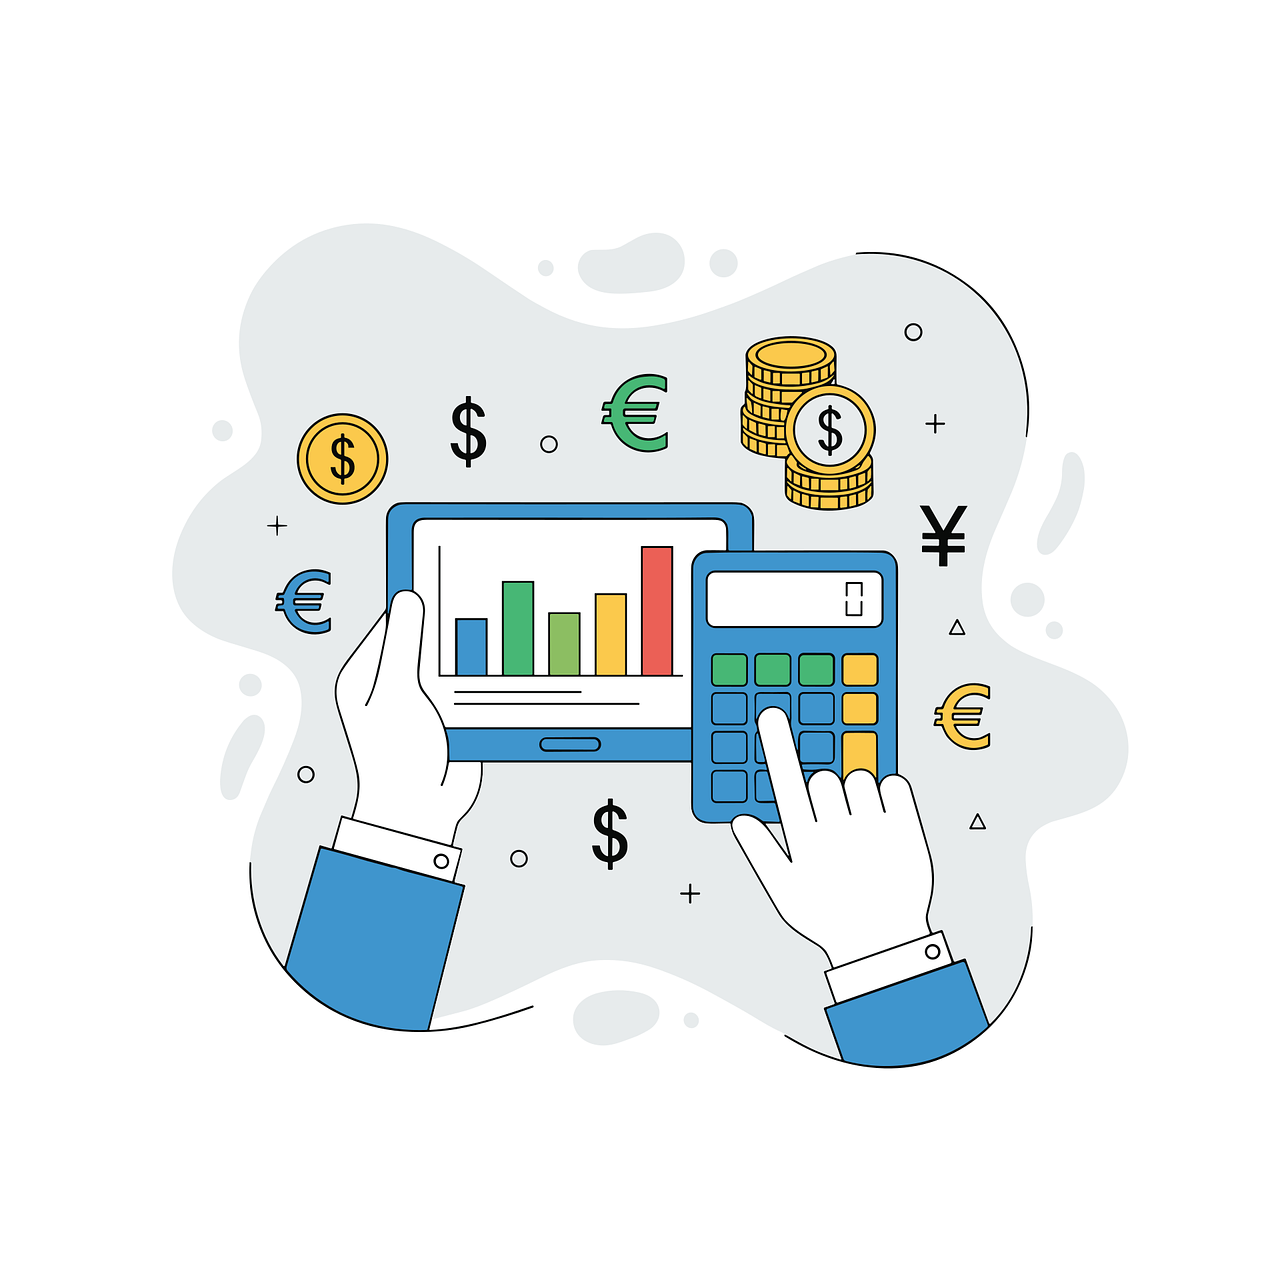
Investment portfolio monitoring encompasses a plethora of metrics that aid investors in evaluating the performance and health of their portfolios. Understanding these metrics is essential for making informed investment decisions. Vital metrics include return on investment (ROI), which indicates the profitability of an investment as a percentage of the initial amount invested, thus helping investors gauge the effectiveness of their strategies. Additionally, monitoring volatility is crucial as it reflects the degree of variation in an investment’s price over time, acting as an indicator of risk. Another essential metric is the Sharpe Ratio, which measures risk-adjusted return; a higher ratio indicates that the investment is yielding better returns relative to the risk being taken. Fear not solely the financials; qualitative metrics, like market analysis and company fundamentals, provide necessary insight into potential risks and opportunities. Through a compelling dynamic dashboard, investors can visualize performance comprehensively, leading them to make timely adjustments that optimize asset outcomes and align with their goals. Combining quantitative and qualitative insights allows for more strategic planning and foresight in achieving superior investment performance.
To successfully create a dynamic financial dashboard for monitoring investment portfolios, understanding the audience and users’ needs is crucial. Different stakeholders, such as portfolio managers, analysts, and clients, may require varying levels of detail and metrics. Therefore, customization should be prioritized; dashboards must be user-centric to promote effective data comprehension. One strategy is to integrate interactive elements that allow users to filter data according to specific preferences; this fosters a personalized experience. An intuitive user interface is fundamental, enabling users to navigate seamlessly. Further, employing visually engaging graphs, such as line charts and pie charts, ensures crucial metrics stand out. Users can quickly grasp trends and distributions, fostering faster decision-making. Another significant aspect of dashboards is real-time updating capabilities, enabling stakeholders to visualize investment performance as it unfolds. Implementing software solutions that provide real-time data feeds strengthens accuracy and relevancy, enhancing overall portfolio monitoring. Adopting responsive design ensures usability across devices, catering to an ever-growing trend of mobile access. Ultimately, a well-structured financial dashboard can serve as a powerful tool, enhancing how individuals manage and track their investment portfolios.
Essential Metrics for Monitoring
When designing financial dashboards, recognizing essential metrics is fundamental to effective monitoring of investment portfolios. Key performance indicators (KPIs) serve as quantifiable data points, allowing investors to measure portfolio performance relative to goals. Common KPIs include Net Asset Value (NAV), which reflects the total value of all assets in the portfolio, and yield, which highlights the income generated by investments relative to costs. Asset allocation is another critical metric; it offers insights into how investments are distributed across categories, such as equities, fixed income, and real estate. Monitoring objective-based returns helps gauge performance against specific investment goals, thereby ensuring alignment with investment strategies. Moreover, tracking ongoing fees and expenses is essential, as they can significantly impact overall profitability; understanding these costs ensures transparency and accountability. Implementation of these metrics within a dashboard enables investors to anticipate fluctuations and act proactively to mitigate risks. Enhancing dashboards with benchmarking data allows users to compare their performance against industry standards or major market indices, positioning investors to make adjustments as needed, ultimately striving for optimal portfolio performance.
Risk assessment is a critical component of effective portfolio monitoring, and it demands special attention in any financial dashboard. Metrics related to risk include Value at Risk (VaR), which quantifies the potential loss in an investment portfolio within a specified time frame, providing investors with vital insights into worst-case scenarios. Additionally, monitoring the standard deviation of returns can help assess an investment’s historical volatility compared to its expected returns. Integrating these risk metrics allows users to visualize risk exposure directly alongside performance metrics. Decision-makers can leverage this information to maintain an optimal balance between risk and return. Another essential metric is the beta coefficient, which measures an investment’s volatility relative to the entire market; this assists investors in understanding how sensitive their portfolios are to market movements. Utilizing heat maps to display risk concentrations adds significant value, making complex data easily digestible. Enhancing dashboards with alerts regarding significant changes in risk factors empowers users to act swiftly in volatile situations, allowing timely modifications of their investment strategies while safeguarding their assets through careful risk management. A dashboard thoughtfully designed to reflect risk enables better-informed decisions.
Visualization Techniques
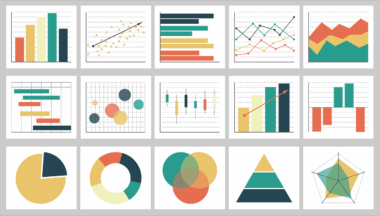
Effectively visualizing data in a financial dashboard is paramount for communicating complex investment information clearly and concisely. Applying visualization techniques like charts, graphs, and tables can significantly enhance comprehensibility. Line charts can depict performance trends over time, providing users with a visual representation of growth or decline. Bar graphs are effective for comparing different assets or investment categories side by side, making it easier to spot underperformance. Tables play a vital role in presenting detailed numeric data, offering a straightforward way to engage with specific metric values. Implementing color coding within these visualizations can enhance readability; for instance, using red for losses and green for gains helps convey essential information instantaneously. Additionally, employing dynamic elements like drill-down containers allows users to engage in a more detailed analysis of underlying data comprehensively. Incorporating infographics can also facilitate storytelling, making complex concepts more relatable and engaging for the audience. Continuous feedback from users should inform visualization choices, ensuring that the dashboard evolves to meet their changing needs and preferences, fostering user satisfaction while supporting robust investment monitoring capabilities.
Performance attribution is a powerful analysis tool included in the portfolio monitoring suite. This metric examines the components that contribute to investment performance, allowing investors to understand what drives their returns. With a dynamic dashboard, users can visualize attribution analysis through various lenses, such as sector contributions, geographical influences, and individual asset performance. By highlighting significant contributors or detractors, stakeholders can identify patterns within the portfolio, pinpointing strengths and weaknesses. Analyzing historical performance through attribution helps investors make decisions about future placements based on empirical evidence rather than speculation. Coupling performance attribution with predictive analytics can provide valuable foresight, allowing users to project future returns based on historical trends. Enabling scenario analysis on a dashboard further empowers users to simulate different market conditions and their potential effects on portfolio performance. Through these multifaceted approaches, performance attribution fosters transparency, accountability, and strategic assessment, creating a comprehensive understanding of how investments truly perform. Enhanced dashboards that incorporate this data enable defined insights, equipping investors to react more effectively to market challenges while maintaining a clear pathway towards achieving desired investment objectives.
Conclusion and Future Considerations
In conclusion, the effectiveness of investment portfolio monitoring significantly relies on the strategic utilization of financial dashboards. Incorporating essential metrics, risk assessment tools, and performance attribution within dashboards enables a holistic view of investments. Adopting user-friendly visualizations empowers users to interact efficiently with their data. As the investment landscape continues to evolve, developing dashboards that leverage advanced technologies, including artificial intelligence and machine learning, will become essential. These innovative tools can offer predictive insights, automating analysis tasks and reducing human error. Additionally, utilizing cloud computing can improve accessibility, allowing real-time collaboration among stakeholders regardless of geographic barriers. Staying informed about current market trends and integrating adaptability in dashboard design will ensure longevity. It is essential for dashboard creators to maintain ongoing feedback loops with users to design features that meet their evolving needs. As investment strategies increasingly incorporate sustainability and social responsibility, dashboards that allow tracking of ESG metrics will likely gain prominence. By embracing these avenues, financial dashboards can further revolutionize how investment portfolios are monitored, providing investors with enhanced clarity and control in a complex financial landscape.
Ultimately, a well-designed financial dashboard acts as the central hub of data-driven investment management. By harnessing the power of visualization and integrating actionable insights, investors can develop a clearer understanding of market dynamics. With the rapid progression of technology, dashboards will continue to evolve, offering advanced features that promote a proactive approach to investment monitoring. As more investors prioritize agility and responsiveness, the success of investment strategies may increasingly depend on the effectiveness of these monitoring systems. Continuous innovation in dashboard design and functionality will ensure they cater to the diverse needs of investors. Engaging with the investment community will unveil the specific requirements and expectations of users, allowing developers to build tools that genuinely serve their purpose. For stakeholders interested in maximizing their portfolio’s performance, embracing the full potential of dynamic financial dashboards is vital. By doing so, they can enhance their investment decision-making process and facilitate better communication among all parties involved in portfolio management. A forward-thinking approach will pave the way for more significant investment successes, turning intricate data into manageable insights that lead to informed actions within the investment landscape.