How to Customize Credit Risk Reporting Dashboards for Your Business Needs
Customizing credit risk reporting dashboards is essential for businesses aiming to effectively manage their financial health. Understanding risk exposure, analyzing trends, and making informed decisions are achievable through tailored dashboards. Start by defining key performance indicators (KPIs) relevant to your organization. These KPIs could include factors such as overdue accounts, payment trends, and customer credit scores. Collect data that aligns with these KPIs for a comprehensive view of credit risk. Next, choose the appropriate visualization tools that suit your need for real-time reporting. Select graphs, charts, and tables that provide clear insights into the data collected. Utilizing data from various sources can enhance dashboard accuracy. Integrate external databases or industry benchmarks for a more robust analysis. This can help highlight significant trends compared to competitors. Furthermore, consider user roles while customizing dashboards. Different stakeholders may require distinct views, such as high-level summaries for executives and detailed data for analysts. By segmenting your dashboard, you cater to varied needs efficiently, ensuring clear communication across departments. Always remember to update the dashboard regularly to reflect the most current data available.
Key Features of Effective Credit Risk Reporting Dashboards
Effective credit risk reporting dashboards should present a wide array of features to facilitate comprehensive risk management. First, clarity is crucial; the information displayed must be easy to understand and interpret. Utilize a clean layout with labeled sections to avoid confusion. Additionally, real-time data updates allow stakeholders to make timely decisions based on the latest information. Automated data feeds can enhance the dashboard’s responsiveness, enabling quicker reactions to emerging trends or issues. Interactivity is another key feature. Allow users to filter data based on various criteria, including time frames, customer segments, and geographic areas. This feature enhances user engagement and insights extraction. Moreover, incorporate predictive analytics to anticipate future risks based on historical data patterns. By forecasting potential scenarios, businesses can prepare for challenges beforehand. Visual customization is vital. Consider offering themes, color schemes, and layout options that users can tailor according to their preferences. This flexibility can improve user experience significantly. Finally, provide access to historical data, enabling organizations to assess long-term trends and the evolution of credit risk over time. This is essential for robust strategic planning.
Integrating Financial Metrics into Your Dashboard
Integrating relevant financial metrics is fundamental for a comprehensive credit risk reporting dashboard. Start with incorporating metrics such as days sales outstanding (DSO) which indicates the average number of days it takes a company to collect payment after a sale. This metric offers a clear indicator of cash flow efficiency. Another critical metric is the accounts receivable aging report, which categorizes outstanding receivables based on the duration they have remained unpaid. By tracking this, businesses can gain insights into customer payment behaviors. It’s also wise to include the collection effectiveness index (CEI) that gauges the effectiveness of the collection process over a specified period. Establishing a historical comparison of these metrics will help identify concerning trends, prompting necessary actions. Implement benchmarking against industry standards to ensure that your organization’s performance remains competitive. This could reveal underperformance areas needing immediate attention. Automated alerts for significant fluctuations within these metrics can further enhance dashboard efficacy. By combining these financial metrics within a user-friendly visual representation, stakeholders can make more informed decisions based on data-driven insights.
Utilizing Data Visualization Techniques
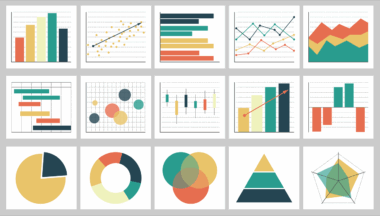
Data visualization techniques play a pivotal role in enhancing the effectiveness of credit risk reporting dashboards. The objective is to convert complex data into visual formats to improve comprehension and facilitate quick decision-making. One common approach is using bar charts for comparing various credit risks across different categories like customer segments or product lines. This technique provides a straightforward way to visualize disparities or identify trends in risk levels. Furthermore, pie charts can represent the composition of credit portfolios, enabling stakeholders to understand proportions easily. Heat maps are another powerful tool; they can highlight areas of significance within data sets, allowing for immediate identification of high-risk sectors. Additionally, trend lines in line graphs exhibit data changes over time clearly, helping to spot emerging patterns. Using gauges to represent metrics against predefined targets adds another layer of interaction. Dashboards should allow users to hover or click on elements for detailed insights when needed. Adopting these visual techniques not only enhances engagement but also promotes actionable insights. Ultimately, embedding effective visual aids transforms raw data into strategic intelligence, guiding the organization towards informed credit management decisions.
Ensuring Data Accuracy and Security
Data accuracy and security are paramount in customizing credit risk reporting dashboards. Begin with establishing robust data governance protocols to maintain data integrity and reliability. This involves setting up procedures to regularly clean and validate data. Use automated systems to flag inconsistencies or unusual patterns that may indicate incorrect data entry or processing errors. Incorporating data auditing processes helps confirm that no significant discrepancies go unnoticed. Additionally, implement access controls to safeguard sensitive credit information. By restricting access based on user roles, you can mitigate the risk of unauthorized data manipulation. Security measures should include encryption methods to protect data during transmission and at rest. Regularly updating software and security protocols minimizes vulnerabilities that could lead to breaches. Furthermore, consider employing multi-factor authentication, providing an extra layer of security for user accounts. Transparency regarding data usage policies is also essential to maintain stakeholder trust. Regular communication with users about how data is handled and stored reassures them of their information’s safety. Overall, prioritizing data accuracy and security enhances the reliability of your credit risk reporting dashboards.
Training Stakeholders for Dashboard Use
Training stakeholders on effective dashboard use can significantly enhance its benefits within an organization. Begin by identifying user groups who will interact with the dashboards, such as management teams, analysts, and financial officers. Each group may have unique needs, requiring tailored training sessions. Utilize workshops or hands-on training sessions to demonstrate the dashboard’s functionality. During these sessions, encourage users to explore the dashboard, familiarizing them with navigation and visualization tools. Providing practical examples based on real business scenarios can help bridge the gap between theory and application. Additionally, create user manuals and video tutorial resources for users to reference on-demand. This is especially valuable for newcomers or infrequent users who may not retain all information from training sessions. Ongoing support is crucial; offer a helpdesk or dedicated channel for queries and troubleshooting. Encourage feedback on the dashboard’s functionality and usability, as user input can drive continuous improvement. Ultimately, investing time in training ensures that your stakeholders can derive maximum value from credit risk reporting dashboards, enabling them to contribute effectively to strategic decision-making processes.
Continuously Evaluating Dashboard Performance
Continuous evaluation of the credit risk reporting dashboard performance is essential for ensuring its long-term effectiveness. Begin by establishing criteria for evaluating performance, which can include user engagement statistics, the frequency of use, and mistargeted reports. Collect and analyze user feedback to gain insights into what works well and what doesn’t. Conduct periodic reviews to assess whether the dashboard still aligns with evolving business needs and industry trends. As regulations and market conditions change, the dashboard may require adjustments to remain relevant. Encourage analytics on user interactions; these analytics can identify which features users find most beneficial and which are underutilized. Based on these findings, you may want to enhance high-use features or consider retraining stakeholders on aspects that are less appealing. Periodic benchmarking against industry standards can also provide perspectives on performance improvements. Establishing a review cycle, perhaps quarterly or biannually, aids in maintaining focus on these assessments. Ultimately, the continuous improvement aspect ensures that your credit risk reporting dashboard evolves alongside your business, reinforcing its role as an indispensable tool for financial management.
Conclusion: Leveraging Credit Risk Reporting Dashboards
In conclusion, leveraging customized credit risk reporting dashboards is crucial for businesses dedicated to maintaining healthy credit management practices. By thoroughly customizing these dashboards, organizations can cater to specific financial objectives, ensuring critical information is always at their fingertips. Employing effective data visualization techniques streamlines the decision-making process, streamlining complex data into manageable insights. Furthermore, maintaining data accuracy and implementing strong security measures fosters stakeholder trust and confidence in the system. Regular training for users optimizes engagement and utilization, allowing organizations to fully exploit the platform’s potential. Establishing procedures for continuous evaluation helps businesses stay agile, ensuring their dashboards evolve with changing needs. Through all these measures, businesses can enhance their understanding of credit risks and strengthen their financial positions. Ultimately, the success of any credit management framework relies heavily on its ability to adapt and respond to dynamic market conditions. By prioritizing customization, clear communication, and user engagement, organizations not only safeguard against financial risks but also position themselves for ongoing growth and success. With a dedicated approach to credit risk reporting, businesses can navigate challenges confidently, informed by valuable insights derived from a well-structured dashboard.